Deeper Analysis
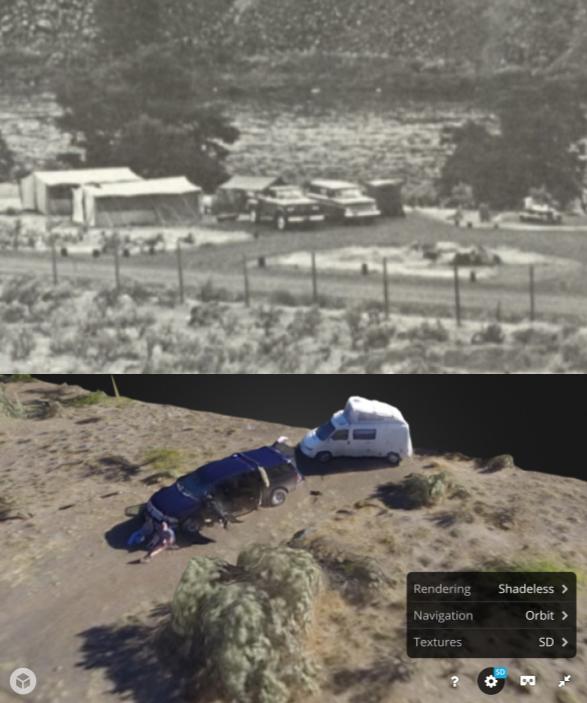
In Part 1 of this story I shared how various inspirations led to a passion-project re-discovering a 6000 year old Native American homesite at the bottom of a river canyon in central Oregon.
I used clues from the environment and old reports from the 1960’s to guide my project. The fresh look on a site that had been well studied in the past, was tickling and amusing for me.
ArcGIS
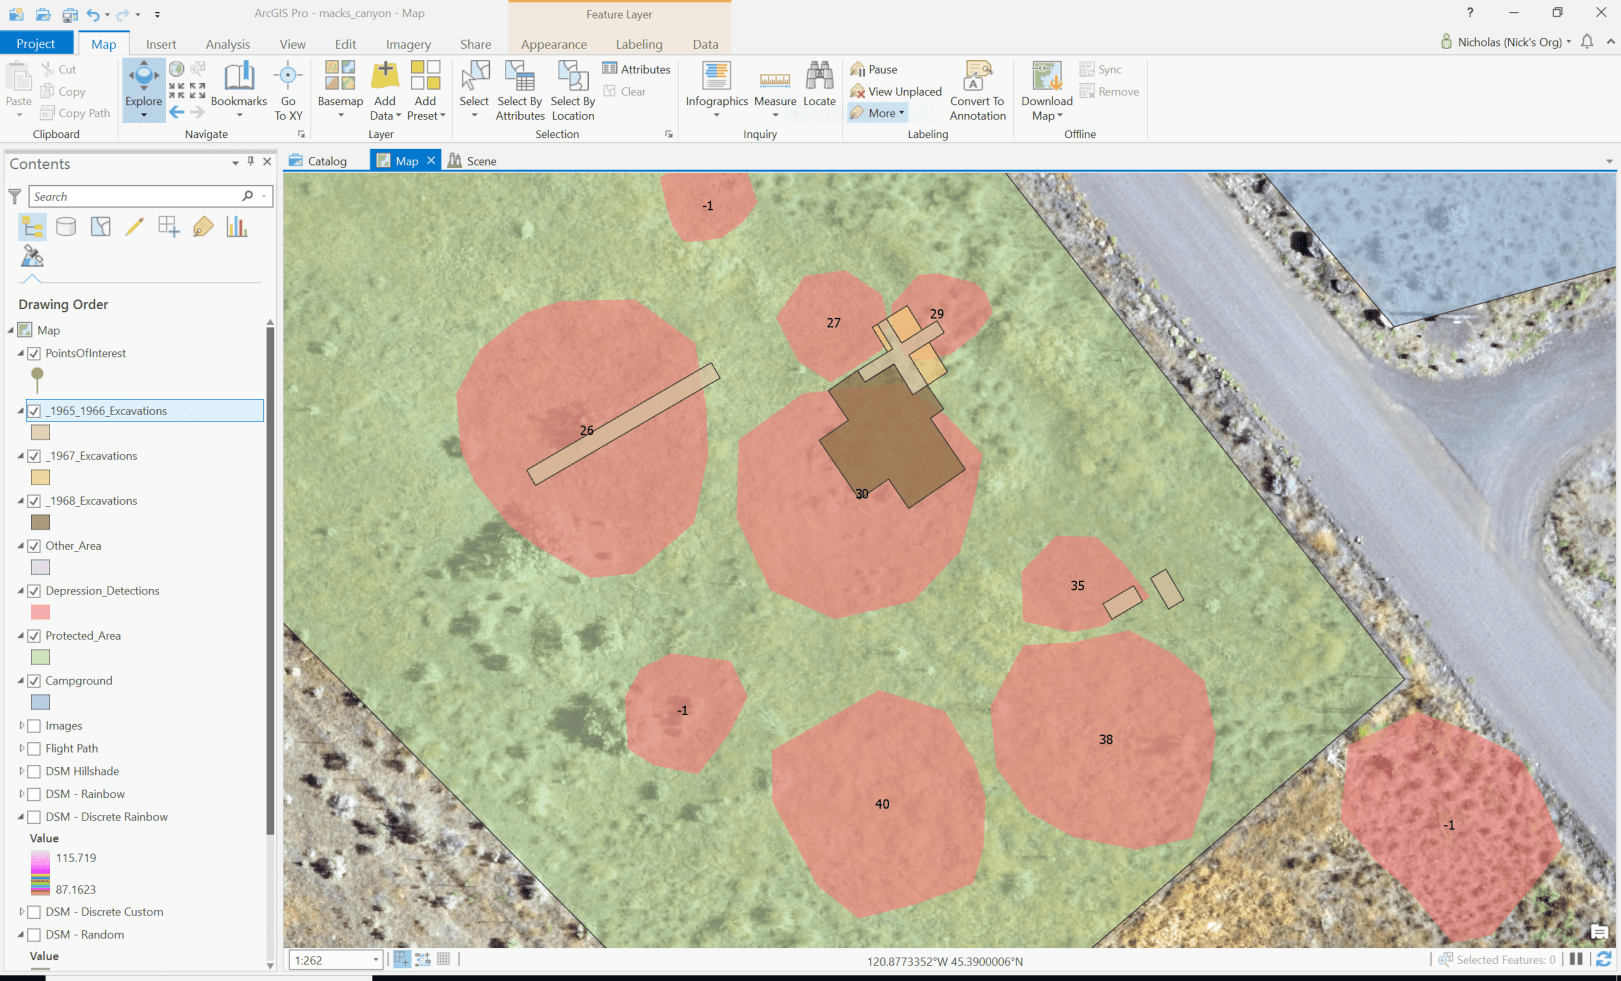
I used this project to dive into ArcGIS, a cumbersome behemoth of a tool. I learned enough over the course of a few weeks to take a closer look at the data I had collected.
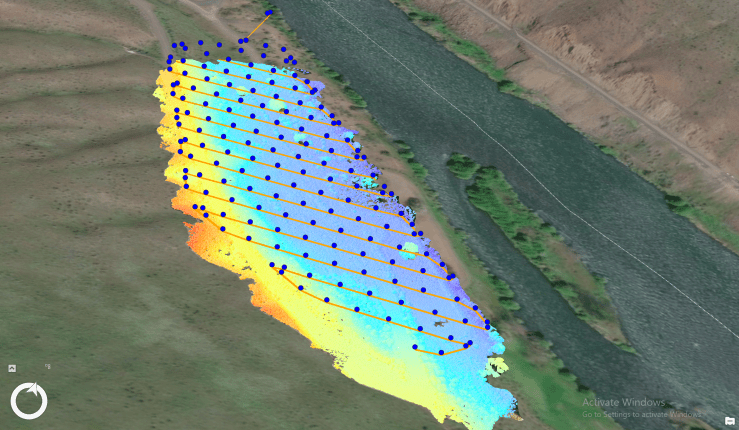
The simple DSM manipulation tools in DroneDeploy were useful for quick and coarse-grained depression detection (seen in Part 1). But, ArcGIS allows for fine-grain control over the symbology representing the data. Using various color coding and discrete elevation bands, many more depressions became apparent.

Going strictly on the new data, without regard for the 1969 map, a total of 25 depressions were found. Several variations on DSM symbology were used to detect depressions. Then, the 2018 depression map was compared side-by-side to the 1969 map.
Only 15 of the 2018 depressions correlated with the records of Cole, 1969. These are listed in the table below as the 15 validated depressions. 10 detected depressions did not correlate.
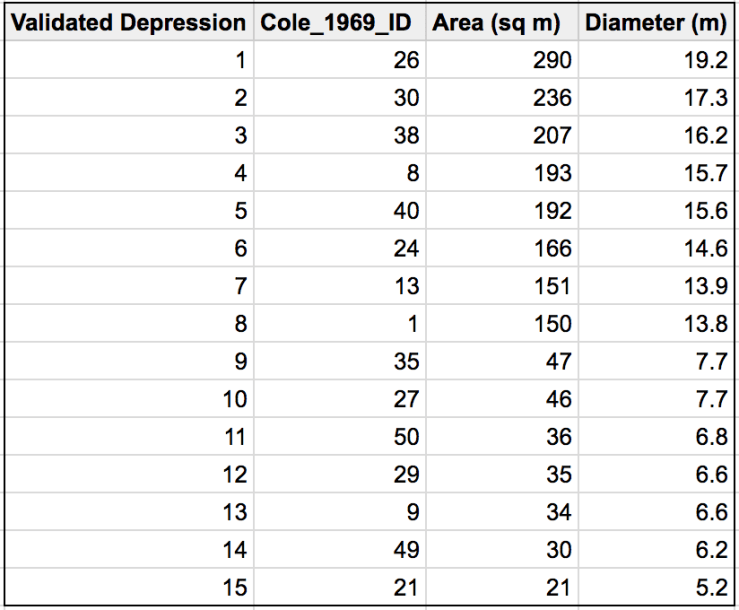
The table shows the mapping between the depressions identified using the 3D drone data to the Cole 1969 map of depressions (Cole_1969_ID). The 10 depressions that did not correlate have been filtered out.

The 10 unvalidated depressions have 2 possible explanations: 1) These are new, previously unidentified house pits or, more likely, 2) These are mis-identified depressions. My guess is that my untrained eye picked up on natural undulations in the landscape that are not associated with Native American house pits.
Additionally, for academic purposes, layers and features were added to represent the excavations from the ’60’s.
Tech Summary
UAV (Unmanned Aerial Vehicle)
- DJI Phantom 3 Professional (with stock camera and gimbal)
Mission details
- Flight date – June 16th, 2016
- Flight time – 10m14s
- Images captured – 161
- Area surveyed – 8 acres
- Weather conditions – clear/full-sun/E wind 5-10mph
Analysis
- DroneDeploy for orthomosaic, photogrammetry, and initial DSM
- ArcGIS Drone2Map for orthomosaic, photogrammetry, and DSM creation.
- ArcGIS Pro Desktop for further DSM analysis
Conclusion
This is fun! Ha. But seriously, it is fun, easy, and super powerful. Low-cost drone technology paired with heavy-duty software turned me into an amateur archaeologist almost overnight. These tools, along with the “magic” of photogrammetry is opening up a world of possibilities and applications.
This was merely a personal project based on my own narrow interest in a place that I feel a deep personal connection to, made deeper by the fresh perspective I gained by digging deeper with drone technology.
My effort here did not serve to push science forward. But it did provide a fresh perspective on a site that has mostly been forgotten since those real, dusty, archaeologists from the University of Oregon put so much of their own time and sweat into getting down and dirty at Mack Canyon.
My real passion isn’t archaeology, but, rather, the use of technology for environmental conservation and ecology. It’s my hope that humans will increasingly use unmanned aerial vehicles as a tool along with our pre-frontal cortices to conserve the delicate interconnected balance in this biosphere.
Sources
- Cole, David L. 1967. Archaeological Research of Site 35SH23 The Mack Canyon Site – Interim Report 1965 – 1966. University of Oregon Museum of Natural History, Eugene, OR.
- Cole, David L. 1969. 1967 and 1968 Archaeological Excavations of the Mack Canyon Site. University of Oregon Museum of Natural History, Eugene, OR.
- Wikipedia, 2018. Mack Canyon Archaeological Site [online]. https://en.wikipedia.org/wiki/Mack_Canyon_Archeological_Site

Awesome Nick! Goes to show drones can be used in an innovative fashion!
LikeLike